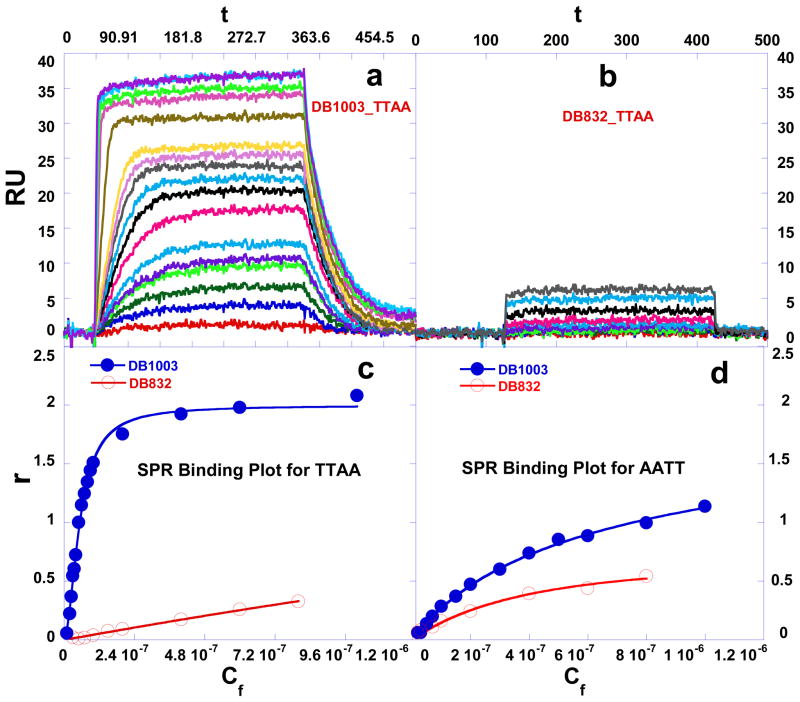
Fig. 4.
Equilibrium binding studies. SPR sensorgrams for binding of (a) DB1003 and (b) DB832 to the TTAA at 25 °C. The unbound compound concentrations in the flow solutions range from 0.0001 μM in the lowest curve to 0.8 μM in the top curve. The RU values from the steady-state region of SPR sensorgrams were converted to r by r = RU/RUmax and are plotted versus the unbound compound concentration for DB1003 and DB832 binding to (c) TTAA and (d) AATT.

