
Figure 1.
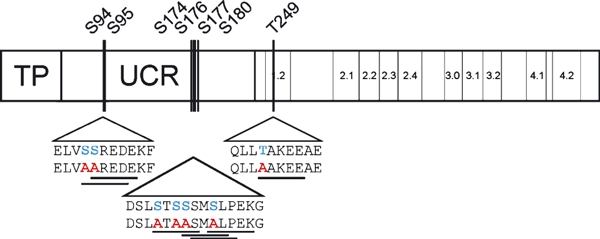
Positions of functionally tested cpCK2 phosphorylation sites on AtSIG6.Scheme showing the principal sigma factor architecture, with the conserved region containing subregions 1.2–4.2 on the right as well as the unconserved region (UCR) and the transit peptide sequence (TP) on the left. The sequences of the analysed substrate sites are enlarged below the triangles: wild type (upper row) and mutant (lower row). Original S or T residues that can function as phosphate acceptors are marked in blue, the exchanges are drawn in red and the entire cpCK2 site is underlined.