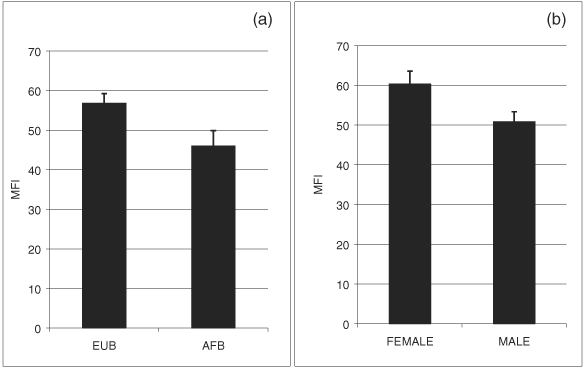
Fig. 1.

Ethnic and sexual differences. (a) Ethnic differences. The amount (MFI) of A antigen on platelets of the A1 subgroup between EUB (n = 143) and AFB (n = 40) was significantly different (Mann–Whitney = 2111·5; Z = 2·53, P = 0·0115). No significant differences were found for the A2 subgroup (EUB, n = 33; AFB, n = 8) (Mann–Whitney = 108·0; Z = 0·79, P = 0·4296). Aint subgroup was not analysed due to the small sample size (n = 17). (b) Sexual differences. The amount (MFI) of A antigen expressed on platelets of the A1 subgroup between male (n = 117) and female (n = 66) was significant (Mann–Whitney = 2867·5; Z = 2·89, P = 0·0039). Bars denote ±1 SEM.
