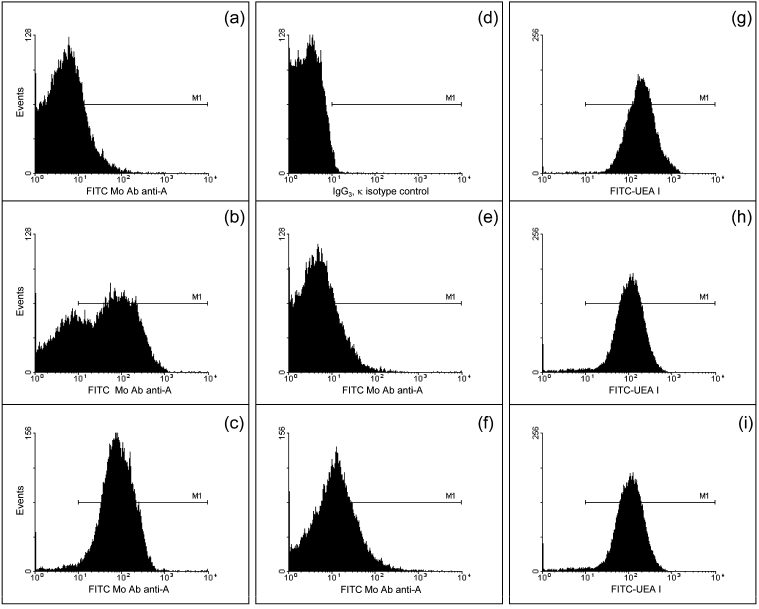
Fig. 2.

Histogram patterns for the blood group A and H antigen expression on platelet membranes. Platelets were dual labelled with (i) a platelet-specific monoclonal antibody (PE-CD41) and FITC-labelled anti-human blood group A monoclonal antibody (a–c, e and f) and (ii) PE-CD41 and FITC anti-H U. europaeus lectin (FITC-UEA I) (g–i). (a and b) The variability patterns of the LE phenotype and (c) the HE phenotype for the A1 subgroup. (d) IgG3κ isotype control for anti-human blood group A. (e and f) Sample histograms of platelets of Aint population. The last column (g–i) shows the same platelet samples shown in a–c exposed to the FITC-UEA I.
