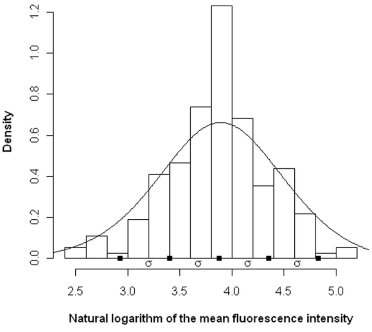
Fig. 5.

Kernel-smoothed curve of A antigen expression on platelets from A1 blood donors. A single normal model, with a mean of the 3·88 ± 0·48 (ln), fitted the data better than a mixture of two or three distributions when submitted to the likelihood ratio test by EM algorithm.
