
Figure 3.
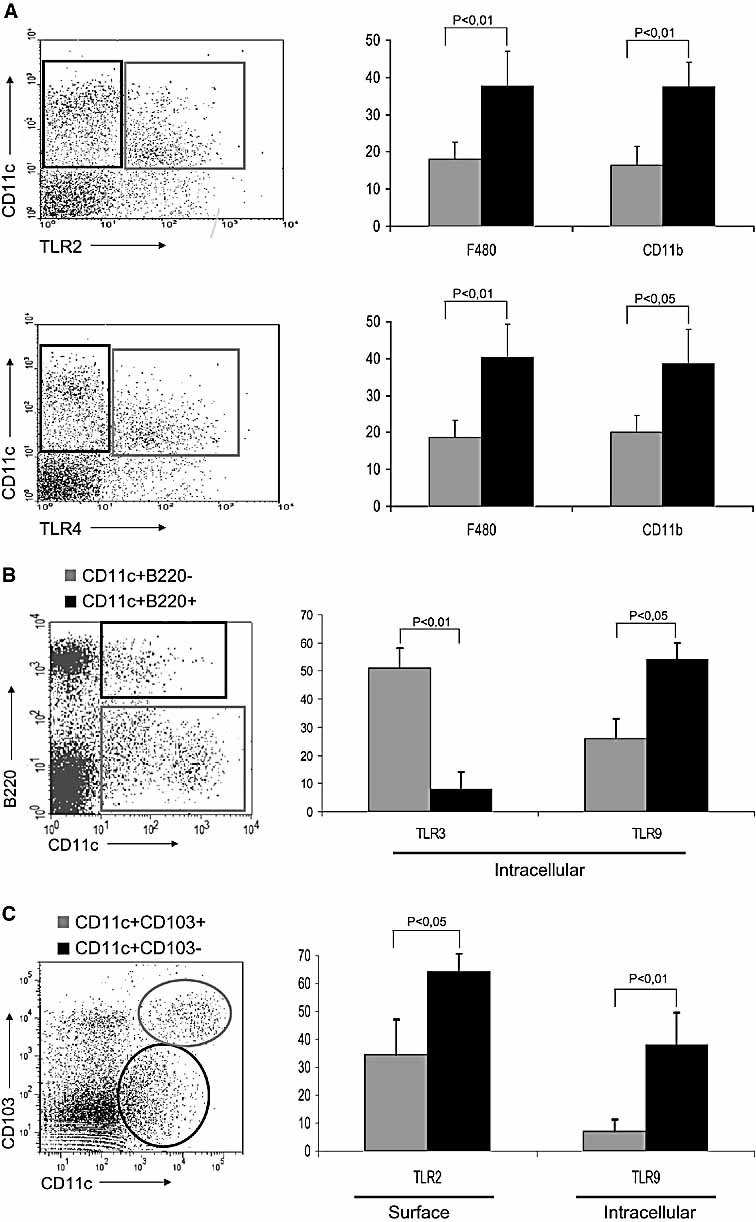
Distribution of TLR expression in different LP DC subsets. (A) TLR are expressed mainly by LP DC (CD11c+CD11b–F4/80–). CD11c+TLR2– and CD11c+TLR2+ subsets of freshly-isolated LP cells were shown in the top left panel. The proportions of live-gated CD11c+TLR2– (black) and CD11c+TLR2+ (grey) DC expressing surface F4/80 or CD11b are shown in the top right panel. CD11c+TLR4– and CD11c+TLR4+ subsets of freshly-isolated LP cells were shown in the bottom left panel. The proportions of live-gated CD11c+TLR4– (black) and CD11c+TLR4+ (grey) DC expressing surface F4/80 or CD11b are shown in the bottom right panel. (B) Expression of TLR by the CD11c+B220– and CD11c+B220+ DC subsets within the small intestinal LP cells (left panel). The proportions of live-gated CD11c+B220+ (black) and CD11c+B220– (grey) DC expressing intracellular TLR3 or TLR9 are shown (right panel). (C) Two subpopulation of DC CD11c+CD103+ (grey) and CD11c+ CD103– (black) were found in freshly isolated small intestinal LP cells (left panel). The percentages of gated CD11c+CD103+ (grey) and CD11c+CD103– (black) DC expressing intracellular TLR9 or surface TLR3 are shown (right panel). The data shown are the percentages of F4/80+, CD11b+ or TLR+ cells out of live-gated (PI–) CD11c+ cells in each tissue and are the mean + 1 SD of three separate experiments.