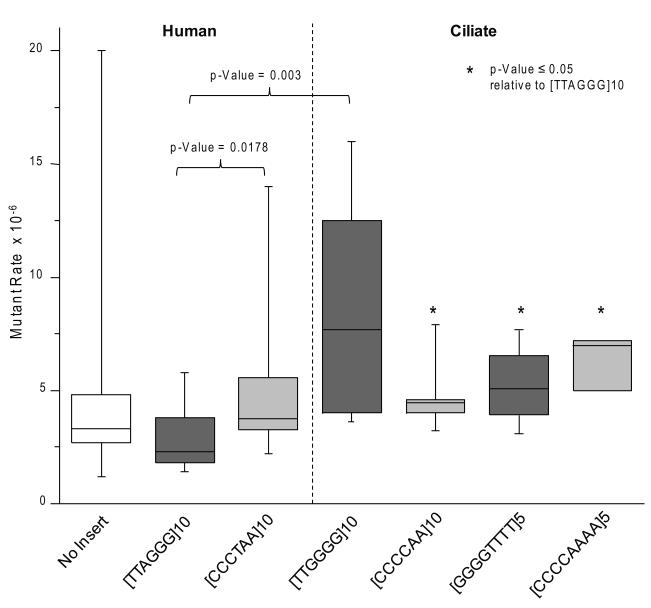
Fig. 4.
Median mutant rates of telomeric shuttle vectors in LCL721 human cells. Clonal populations of human cells bearing various shuttle vectors were expanded for 26 to 29 generations. Shuttle vector DNA was isolated from each clone and the HSV-tk mutant frequency was determined as described in Materials and Methods. The mutant rate was calculated by dividing the mutant frequency by the number of generations the clone was expanded to at the time of shuttle vector isolation (see also Supplemental Tables S3 and S4). Each box represents the interquartile range (25th to 75th percentiles). The horizontal bars in the boxes represent the medians. The vertical bars represent the range of values included in the statistics, from the maximal to the minimal value. The following outliers were excluded: 27 [no insert control]; 71 [CCCTAA]10; and 38 [CCCCAAAA]5. * indicates p≤ 0.05 relative to [TTAGGG]10 (Mann-Whitney rank sum test (two-sided)).

