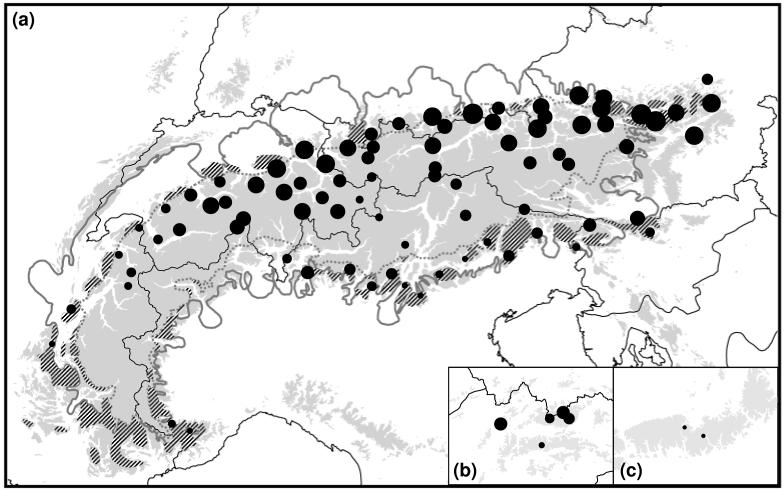
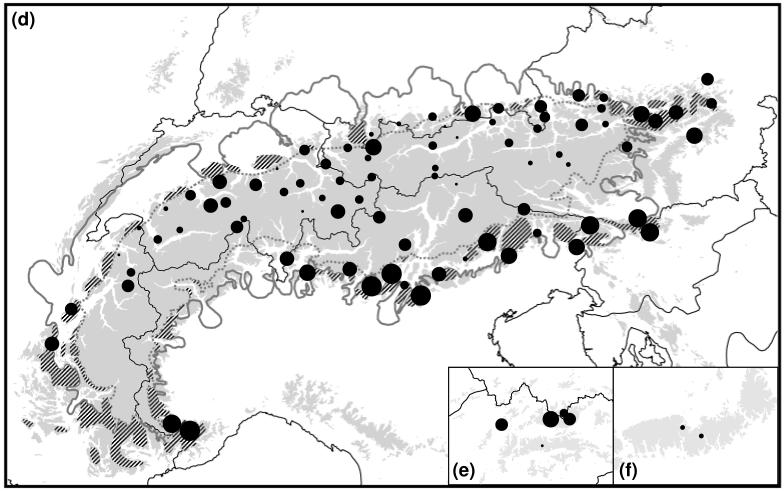
Figure 2.
Patterns of within-population genetic diversity (πn, a-c) and rarity (DW, d-f) in the AFLP data in 89 sampled populations of the Ranunculus alpestris group. The size of the dots is directly proportional to the degree of genetic diversity, or rarity, respectively. (a, d) Alps; (b, e) Western Carpathians; (c, f) Southern Carpathians (see also Fig. 1 and Appendix 2). Within the Alps, the hatched areas indicate presumed glacial refugia (Schönswetter et al. 2005); the continuous grey line shows the maximum extent of the ice sheet; and the broken grey line indicates represents the Last Glacial Maximum snow line.


