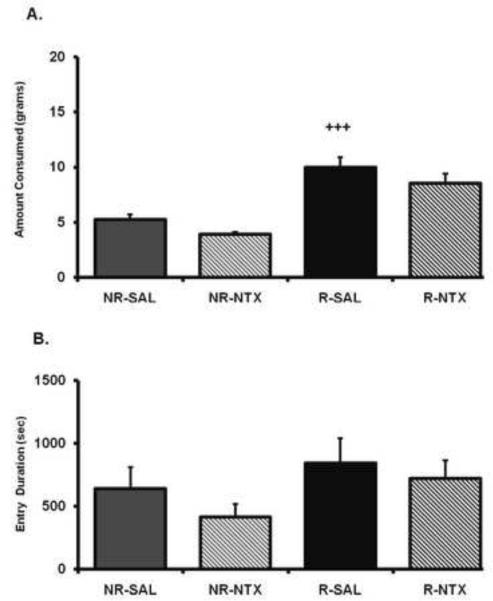
Figure 2.
(A) Amount of food intake and (B) hopper entry duration (duration of beam break at entry of hopper) after 24-hr food deprivation (R) or no deprivation (NR) after either naltrexone (NTX; 5 μg/0.25μl per side) or saline (SAL) administration into the BLA. The x axis labels refer to deprivation state and intra-BLA treatment (i.e., deprivation state-BLA treatment). Values represent group means (+/− S.E.M.). Plus sign represents NR/SAL versus R/SAL. Level of significance noted, p < .001.

