
FIG. 3.
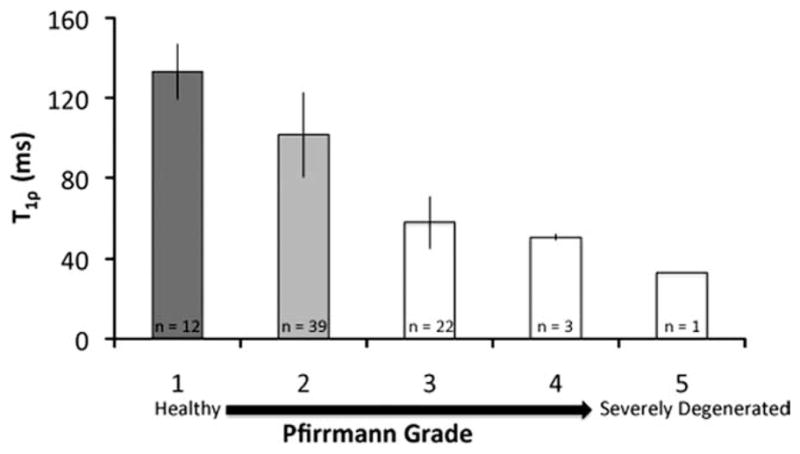
Median T1ρ values (±standard deviation) in each Pfirrmann grade are illustrated in the graph (16 patients, 77 discs). The plot is limited because it ignores differences between lumbar regions and is unable to properly account for the within- and between-subject structure of the data. However, the plot does provide an illustration of the behavior of T1ρ values with respect to Pfirrmann grade. Groups that are significantly different (P < 0.05) are categorized by different colors, as determined from the linear regression model. Note that the T1ρ values in the Pfirrmann grade 2 discs were significantly different from those in Pfirrmann grade 1, as evidenced by the mixed-effects regression model (which allows for subject-specific random effects), suggesting that T1ρ relaxation time may be sensitive to early degenerative changes.