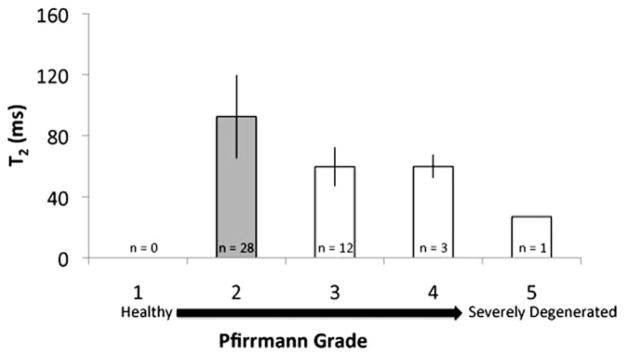
FIG. 4.
Median T2 values (±standard deviation) in each Pfirrmann grade are illustrated in the graph (n = 9 patients, 44 discs). The plot is limited because it ignores differences between lumbar regions and is unable to properly account for the within- and between-subject structure of the data. However, the plot does provide an illustration of the behavior of T2 values with respect to Pfirrmann grade. Groups that are significantly different (P < 0.05) are categorized by different colors, as determined from the linear regression model.

