
Figure 2. Functional analysis of mouse, frog and rat cation–chloride cotransport with 86Rb (K+) flux in Xenopus laevis oocytes.
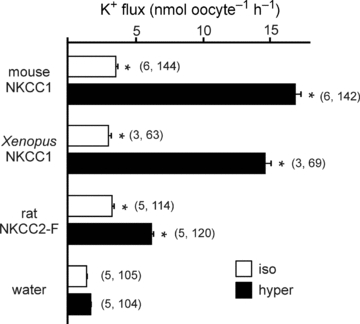
Water (50 nl) containing 15 ng of cRNA from wild-type mouse NKCC1, frog NKCC1 or rat NKCC2 (F variant) were injected on day 2. Oocytes injected with 50 nl of water only were used as baseline controls. K+ flux was measured on day 5 in isosmotic (195 mosmol l−1, open bars) and hyperosmotic (265 mosmol l−1, filled bars) conditions. Bars represent mean ±s.e.m. (number of frogs, number of oocytes). Asterisk indicates highly significant difference (P < 0.001) between groups, relative to water-injected oocytes.