
Figure 7. NKCC1–NKCC2 chimeras were tested by functional analysis of 86Rb (K+) flux in Xenopus laevis oocytes.
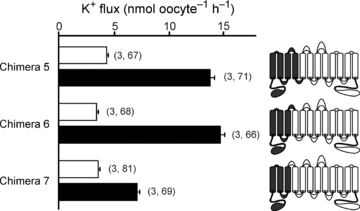
Water (50 nl) containing 15 ng of cotransporter cRNA was injected on day 2. K+ flux was measured on day 5 in isosmotic (195 mosmol l−1, open bars) and hyperosmotic (265 mosmol l−1, filled bars) conditions. Cartoon colouring illustrates the contribution of NKCC1 (grey) to NKCC2 (white) in each chimera. Bars represent mean ±s.e.m. (number of frogs, number of oocytes).