
Figure 2. AVV transfection of HMNs with functional nNOS.
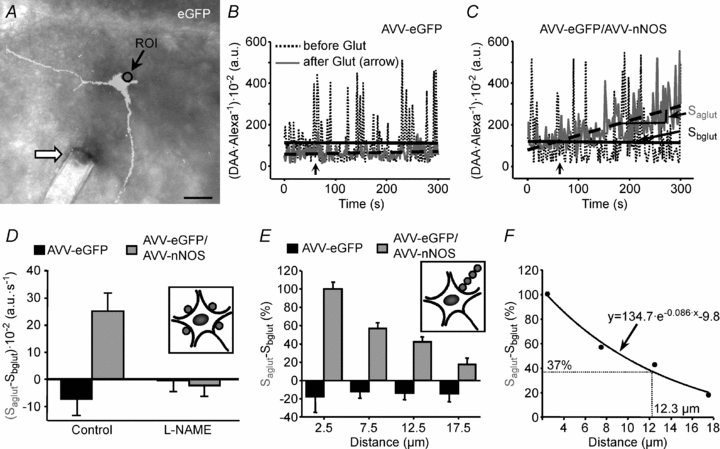
A, merged DIC and eGFP channels showing the tip of a pipette (arrow) ejecting dyes close to an eGFP-transfected HMN. The circle indicates the region of interest (ROI) used to construct the plot illustrated in B. Calibration bar: 50 μm. B and C, time courses of the DAA/Alexa 633 ratio within a 5 μm diameter ROI placed just at the border of transfected HMNs by means of the indicated adenoviruses before and after addition to the perfusate of l-glutamate (500 μm; arrows). Slopes of the regression lines adjusted before (Sbglut) and after (Saglut) glutamate addition are indicated in C. The slope increase after Glut application in C is the resultant of a rise in DAA relative to Alexa fluorescence. This indicates that NO synthesized by transduced HMN interacts with the NO-sensitive dye DAA. D, averaged Saglut–Sbglut obtained from HMNs transfected with the specified adenoviruses and incubated with the indicated drugs. Drugs were added to the bath 5 min before glutamate. Inset, illustration signalling the location of ROIs analysed per motoneuron. The average of Saglut–Sbglut was taken as the representative value for a HMN. The number of analysed HMNs per condition was as follows: AVV-eGFP, n = 4 from 3 pups; AVV-eGFP/AVV-nNOS, n = 3 from 3 pups; AVV-eGFP+l-NAME (2 mm), n = 3 from 3 pups; AVV-eGFP/AVV-nNOS+l-NAME (2 mm), n = 4 from 2 pups. Prevention of the slope increase after Glut by pre-incubation with the NOS inhibitor l-NAME strongly suggests that the change in the slope is mediated by generation of NO. E, NO gradient in brain tissue surrounding nNOS expressing HMNs. Average Saglut–Sbglut obtained from HMNs transfected with the indicated adenoviruses relative to the distance of the centre of the ROI to the motoneuron border. Measures have been normalized relative to the value obtained in the ROI nearest to the motoneuron. Inset illustrates how ROIs were located for this type of measure. The number of analysed HMNs per condition was as follows: AVV-eGFP, n = 6 from 6 pups; AVV-eGFP/AVV-nNOS, n = 13 from 10 pups. F, data presented in E were well fitted to the exponential decay equation used to calculate the theoretical space constant of the NO gradient created around AVV-nNOS transfected motoneurons.