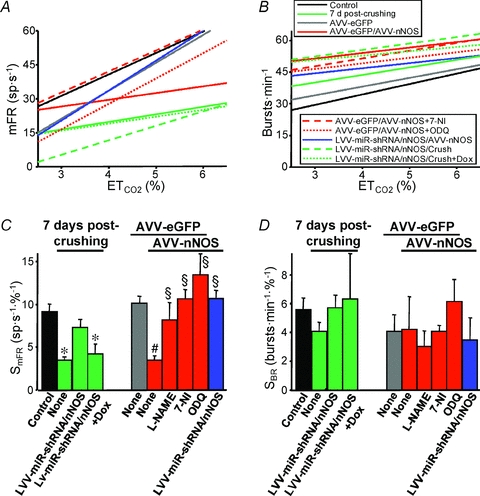
Figure 6. Quantification of the effects of transgenic nNOS expression and viral nNOS knock-down in the HN on the chemoreceptor-modulated inspiratory activity of HMNs.

A and B, plots showing representative linear regression lines of mean firing rate (mFR, A) per burst or burst rate (BR, B) versus for motoneurons recorded at the indicated conditions. The slopes of the regression lines represent the neuronal sensitivity to or gain in response to
  changes (SmFR, in spikes s−1%−1; SBR, in bursts min−1%−1). C and D, average values of SmFR (C) and SBR (D) obtained from the motoneuron pools recorded under the indicated conditions. The number of analysed HMNs per condition is indicated in Table 2. Significant differences (P < 0.05; one-way ANOVA; post hoc Tukey's test) relative to control (*), AVV-eGFP- (#) or AVV-eGFP/AVV-nNOS-injected (§) groups. Note that the sensitivity of HMNs mFR to
  was similarly reduced after nerve crushing or AVV-nNOS intranuclear injection. In both cases alterations were fully prevented by LVV-miR-shRNA/nNOS.
