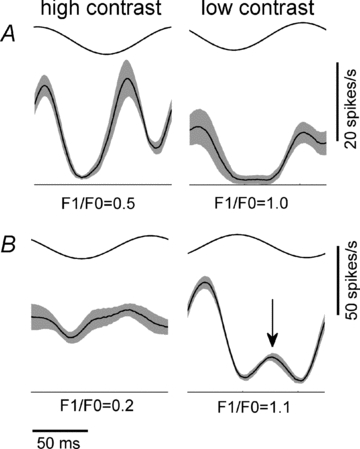
Figure 5. Representative responses of two cells presented with high contrast (100% contrast, left column) and low contrast (16% contrast, right column) moving gratings, together with their F1/F0 ratios.

Both cells have low F1/F0 ratios (i.e. both cells are complex) when tested at high contrast. The cell in A exhibits a frequency doubled response at high contrast but a classical simple-like oscillatory response at low contrast. The cell in B shows very little modulation in its response at high contrast. However, at low contrast it displays a strong oscillation at the frequency of the input (F1) together with a small (but significant) out-of-phase response (arrow).
