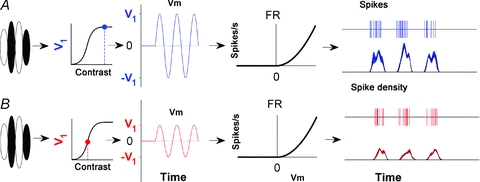
Figure 7. Modelling the effects of contrast on a simple cell.

A and B show a classical model simple cell and its response to high and low contrast moving gratings (shown in blue and red respectively). In both panels the output of the linear filter that defines the cell's receptive field produces a sinusoidal oscillation in the membrane potential in response to a sinusoidal grating. The amplitude of this sinusoid (V1) is a sigmoidal function of contrast. The membrane potential is rectified and transformed into an instantaneous firing rate via a power-law non-linearity. The form of the power function is illustrated by the graphs that plot the firing rate (FR) in spikes s−1 against the membrane potential (Vm). Spikes are produced through a random Poisson process where the rate depends on the output from the non-linear stage. The phasic nature of the response of this cell is maintained at low contrasts even though the gain is decreased.
