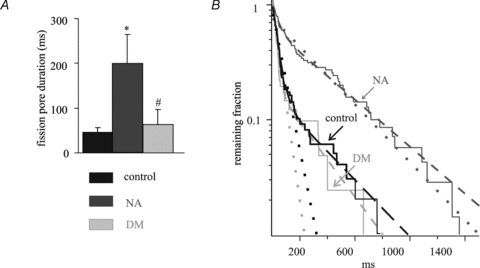
Figure 3. NA preferentially inhibits the rapid fission pore closure.

A, the mean of the median values of fission pore duration for each patch under control and experimental conditions. B, the survival curves (continuous lines) of fission pore duration for control and test cells were plotted on a logarithmic scale. The survival curves are fitted with single exponential decays (dotted lines) and double exponential decays (dashed lines). The arrows indicate the different experimental conditions. Data were analysed from all the events obtained in Fig. 2. *P < 0.05, **P < 0.01, #n.s.
