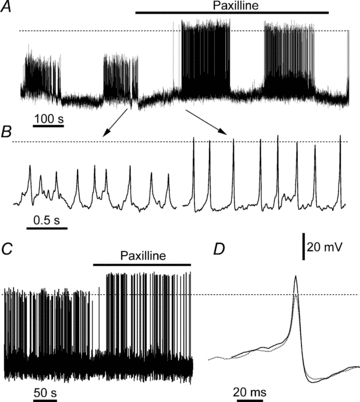
Figure 1. Effects of BK channel blocker paxilline on the electrical activity of glucose-stimulated islets and single β-cells.

A, membrane potential recording in an islet exposed to 11.1 mm glucose, showing typical bursting. Paxilline (1 μm; horizontal bar) dramatically increased AP height. B, data from A on an expanded time scale. The arrows show approximate location of traces in A. C, effect of paxilline on APs of a single β-cell exposed to 1 μm paxilline in 11.1 mm glucose (denoted by the horizontal bar). D, two APs extracted from the trace in C are shown superimposed; dotted and continuous traces were recorded in the absence and presence of paxilline, respectively. Dashed lines denote 0 mV level; all panels have the same voltage calibration.
