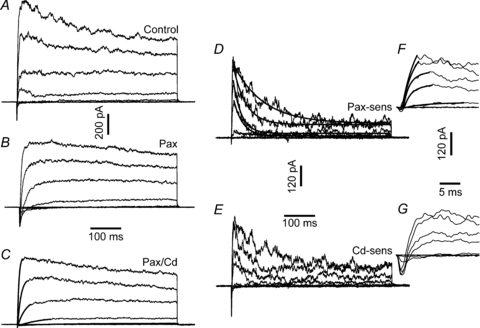
Figure 3. Voltage- and time-dependence of IBK and IKv.

Family of membrane currents activated by IV1 protocol. A, control (5 mm glucose + 200 μm tolbutamide). B, in 1 μm paxilline. C, IKv recorded in the presence of Cd2+ and paxilline. The continuous lines are single exponential fits to the rising phase of the current. D, paxilline-sensitive IBK, obtained by subtracting the currents in B from A. The continuous lines are monoexponential fits of IBK decay. E, Cd2++ paxilline-sensitive current, obtained by subtracting traces in C from A. F, IBK activation. The early phase of IBK, shown in D, is plotted on an expanded time scale. The continuous lines are double exponential fits to IBK rising phase. G, early inward ICav current. The traces were obtained by plotting the early stages of the traces in E on an expanded time scale. The leftmost calibration bars refer to A, B and C; the middle bars refer to D and E, and the rightmost bars refer to F and G.
