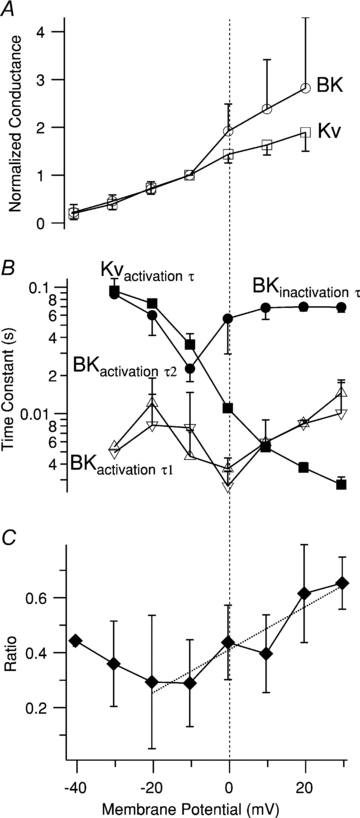
Figure 4. Voltage dependence of amplitude and kinetics of IBK and IKv.

A, normalized conductance–voltage (G–V) curves for IBK (open circles) and IKv (open squares). Each point is the mean ±s.e.m. of 3–4 determinations in different cells normalised to the value at −10 mV. B, voltage dependence of the time constant of IKv activation (Kvactivation τ; filled squares), the time constant of IBK inactivation (BKinactivation τ; filled circles), the first time constant of IBK activation (BKactivation τ1; upright open triangles), and the second time constant of IBK activation (BKactivation τ2; inverted open triangles). Each point is mean ±s.e.m. of 3–4 determinations. Note logarithmic axis for τs. C, voltage dependence of ratio of steady-state IBK current (average of IBK over the last 100 ms of the 500 ms pulse) to peak IBK. Each point is the average of 3–4 measurements in separate cells, except the leftmost point, which is a single determination. The dotted line is a linear fit to the data between −20 and +30 mV; its slope is 0.0078 mV−1. The membrane potential axis is the same for all panels; the vertical dashed line denotes 0 mV.
