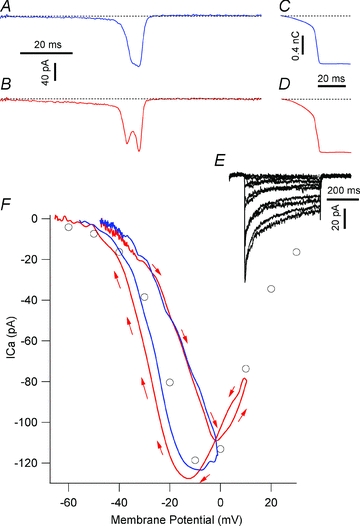
Figure 6. ICav activation by AP-waveform commands.

ICav activated by AP1 (A) and AP2 (B) commands. C and D show the corresponding cumulative Ca2+influx (QCav). The dashed lines indicate the zero ICav or QCav. E, a family of ICav traces activated by IV1 protocol, recorded in the same cell as panels A and C. F, comparison of ICav waveforms activated by AP commands and step depolarisations. Circles represent the voltage dependence of peak ICav traces activated by the depolarizing steps in E. Blue and red curves represent the ICavs activated by AP1 and AP2, plotted as a function of their voltage waveforms. The red arrows illustrate the direction of the current progression with time in response to AP2 command. Both currents loop clockwise, beginning and ending at the top left corner of the panel; the current activated by AP2 (red trace) has an additional anticlockwise loop, covering ∼−5 to +15 mV potential range, nested within the main current loop.
