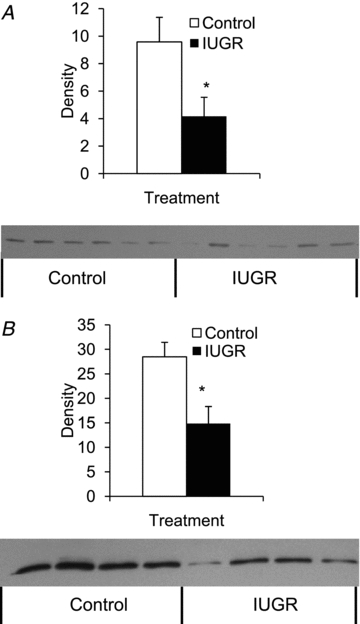
Figure 3. Immunoblot analysis for β2-AR in perirenal adipose tissue.

β2-AR protein concentrations were measured in fetuses (A) and lambs (B). Representative immunoblots for plasma membrane enriched fractions from control (□) and IUGR (▪) perirenal adipose tissue are presented below the bar graphs, which summarize the 68 kDa band intensities from each treatment group. Significance from Student's t test is depicted with an * (P < 0.05) for each age.
