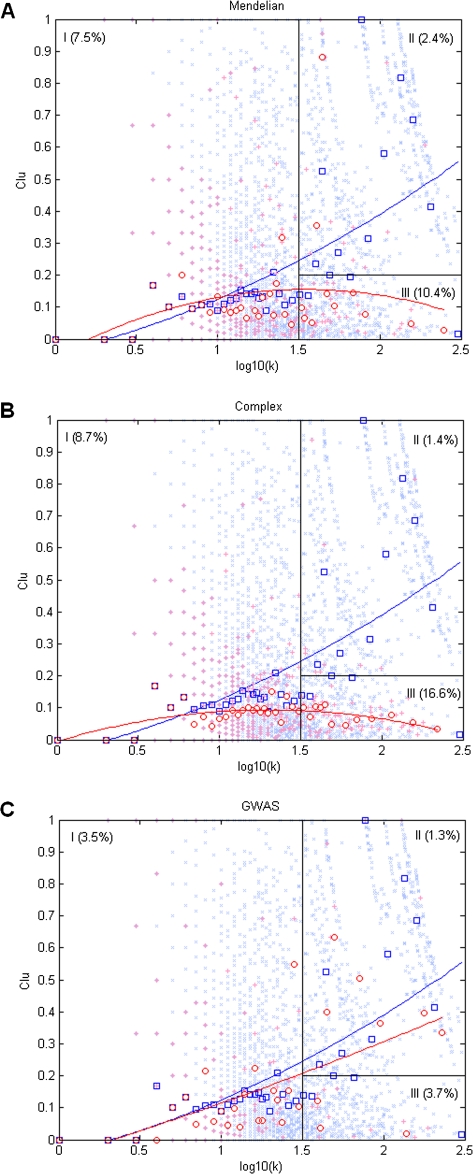
FIG. 2.—
Characteristic changes of clustering coefficient (Clu) as a function of degree (k) for disease genes. Red crosses are data points of disease genes, (A) Mendelian, (B) complex, and (C) GWAS. Red circles are means of Clu for data points in the bins with unequal widths (so that each bin contains same number of disease genes). Blue crosses and blue squares are for nondisease genes for comparison. The solid line shows the quadratic fit of a linear model with first-order and second-order predictors of log10(k). The red and blue lines are for disease and nondisease genes, respectively. Rectangles represent three empirically defined regions (I, II, and III). Percentages of genes that are disease genes in each region are given in parentheses. The results of χ2 tests for the percentage of region III against those of regions I and II are III versus II, P = 7.4 × 10⁻⁹ and III versus I, P = 0.02 for Mendelian disease genes; III versus II, P = 0 and III versus I, P = 8.9 × 10⁻⁹ for complex disease genes; III versus II, P = 0.008 and III versus I, P = 0.8 for GWAS genes.

