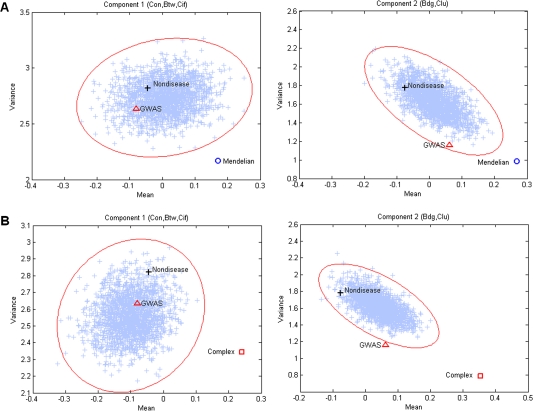
FIG. 4.—
Variance and mean of PCs of disease genes. The open circle and square indicate observed data points of variance against mean of the two PCs for Mendelian and complex disease genes, respectively. The crosses are data points of mean and variance for 10,000 randomly sampled subsets of nondisease genes, with the same size and age distribution as (A) Mendelian and (B) complex disease genes. The contour denotes the 99.9% confidence ellipse.

