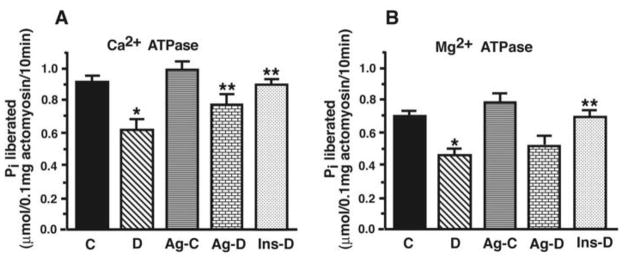
Figure 5.
Panel A shows representative absorbance traces used to assess syneresis of MHC following addition of ATP (1mM). Panel B show mean ± S.E.M for eight experiments done using seven different actomyosin preparations per each group. * - Significantly different from control (p<0.05). ** - Significantly different from STZ-diabetic (p<0.05).

