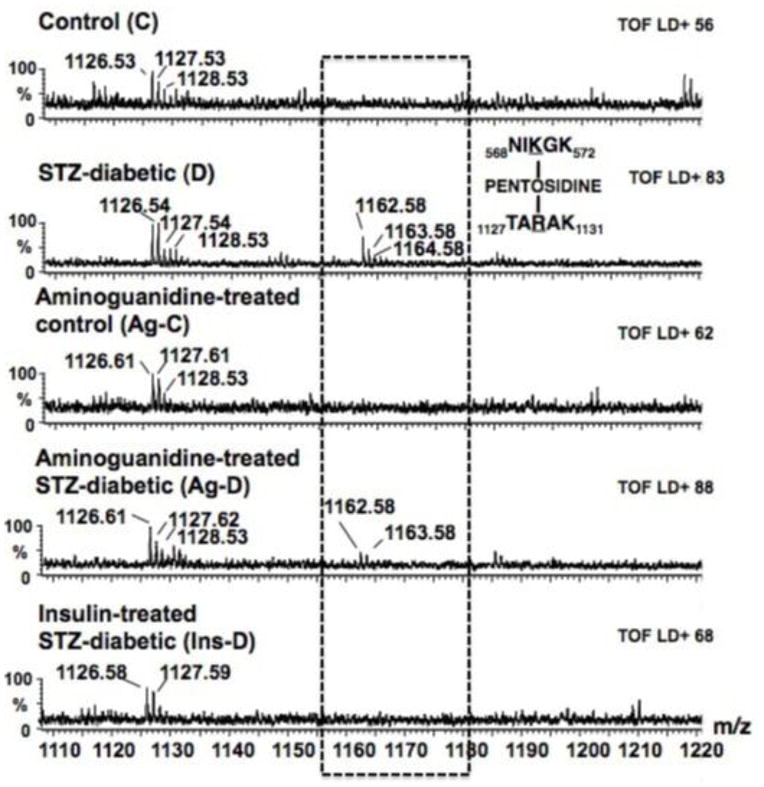
Figure 6.
Shows alignment of a segment of MALDI-TOF mass spectra obtained following trypsin digestion of MHC from control (C), STZ-diabetic (D), Ag-treated control (Ag-C), Ag-treated STZ-diabetic (Ag-D) and insulin-treated STZ-diabetic (Ins-D) rat hearts. The STZ-diabetic sample shows a prominent peak at 1162.58 Da (1163.58 Da and 1163.58 Da are isotopic mass peaks) that is not seen in either control or Ag-treated control sample. Using our in-house PERLscript, this peak was assigned to 568NIKGK572 and 1127TARAK1131 crosslinked together by pentosidine.

