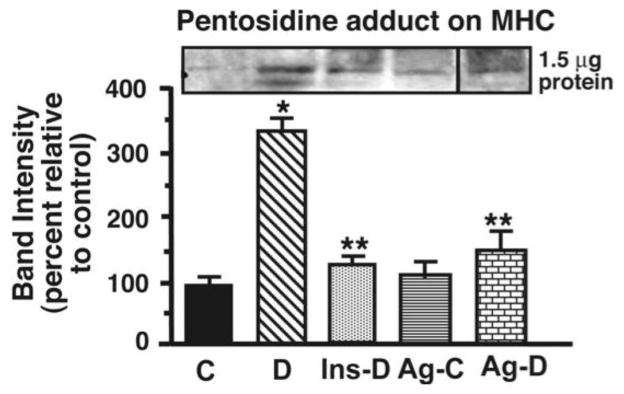
Figure 7.
Relative levels of pentosidine adduct in hearts from control (C), STZ-diabetic (D), Ag-treated control (Ag-C), Ag-treated STZ-diabetic (Ag-D) and insulin-treated STZ-diabetic (Ins-D) rat hearts. The graph below represents the mean ± S.E.M for five experiments done using five different actomyosin preparations from each group. * - Significantly different from control (p<0.05). ** - Significantly different from STZ-diabetic (p<0.05).

