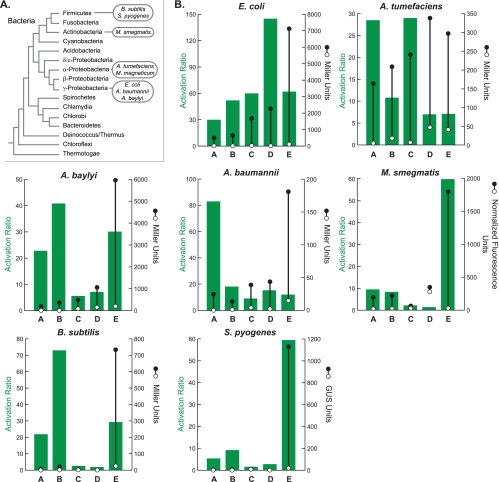
FIG. 1.
(A) Bacterial phylogeny. The species studied here are shown in the ovals. (B) Activation ratios and expression levels for riboswitches A to E in each organism. Right axes: expression levels in the absence of theophylline (open circles) and in the presence of theophylline (2 mM; closed circles). Measurements are of β-galactosidase activity in Miller units (20) for all organisms, except for S. pyogenes (β-glucuronidase [GUS] activity in GUS units [14]) and M. smegmatis (normalized fluorescence of GFP [8]). Errors are smaller than the symbol size. Left axes: activation ratios of the riboswitches, which were determined by dividing expression levels in the presence of theophylline by expression levels in the absence of theophylline.

