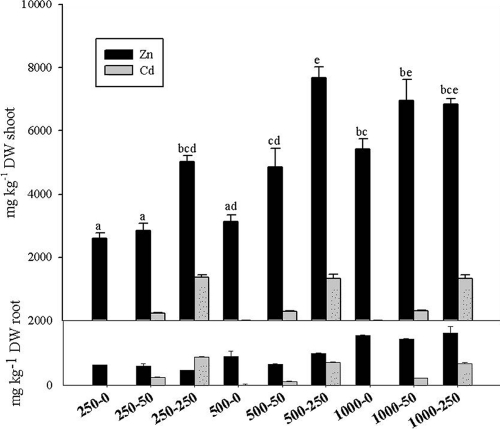
FIG. 1.
Shoot and root metal concentrations at the end of the experiment in T. caerulescens plants subjected to different Zn (first value) and Cd (second value) soil concentrations (mg kg−1 [DW]). Bars labeled with different letters are significantly different (P < 0.05) according to the Tukey-Kramer test (statistics are shown only when, according to two-way ANOVA, a significant interaction was found between soil Zn and Cd concentrations). Mean values (n = 4) and standard errors are shown.

