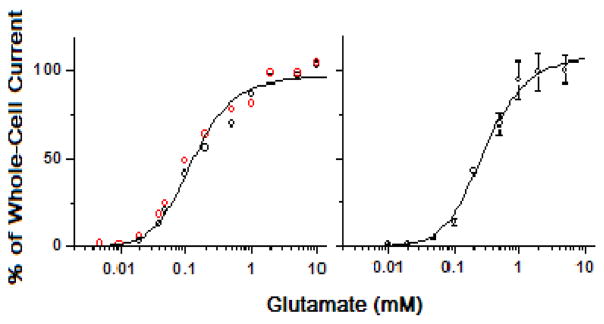
Figure 3.
Dose-response relationship of the wild-type hGluK2 (black circle, left panel) and the M867I mutant hGluK2 (red circle, left panel), and the wild-type rGluK2 (right panel). Each data point is an average of at least three measurements from three different cells. A total of 33, 37 and 52 cells were measured for the wild-type human, the mutant and the rat GluK2, respectively. The whole-cell current amplitudes from different cells were normalized to that of the control or 0.5 mM glutamate, and the average of the current amplitude collected from ≥2 mM glutamate concentrations was set to be 100%. The solid line is the nonlinear fit of the combined data based on eq 3 (see the detailed results of the fitting in Table 1 for the human and Table 2 for the rat GluK2). From the combined data, when n = 2, K1 of 170 ± 23 μM, Φ of 0.29 ± 0.03 and IMRM of 125 ± 8 were obtained for the hGluK2 and the M867I mutant (left panel). Likewise, K1 of 300 ± 21 μM, Φ of 0.48 ± 0.73 and IMRM of 161 ± 84 at n = 2 were obtained for the rGluK2 (right panel).

