
Figure 4.
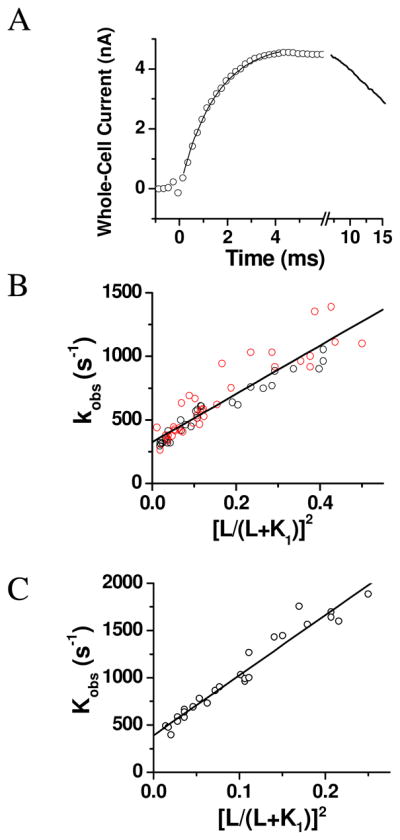
(A) A representative whole-cell current trace generated by the laser-pulse photolysis measurement with an HEK-293 cell expressing the wild-type hGluK2. A pulse of laser was fired at time zero. The concentration of glutamate released was estimated to be 200 μM. The kobs was calculated from the rising phase of the current to be 900 ± 12 s−1 by using eq 1 (the solid line). Note that the current is plotted opposite to the direction that is recorded. (B) Linear plot of the kobs data combined from the wild-type and the M867I mutant hGluK2 as a function of glutamate concentration according to eq 2. Each data point represents a single kobs value obtained at a particular concentration of photolytically released glutamate. Overall, a total of 29 and 36 cells were measured for the wild-type (black circle) and the mutant hGluK2 (red circle). The best fit of kobs was at n = 2, and the kop and kcl values were (1.9 ± 0.1) × 103 s−1 and (3.3 ± 0.2) × 102 s−1, respectively. See Table 3 and Tables S2 and S4 for a detailed description of nonlinear fits. (C) Linear plot of kobs as a function of glutamate concentration by eq 2, based on a total of 26 cell measurements, for the rGluK2. The best fitted kop and kcl values were (6.4 ± 0.1) × 103 s−1 and (3.9 ± 0.3) × 102 s−1, respectively, at n = 2. See Table 4 and Tables S3 and S5 for a detailed description of nonlinear fits.