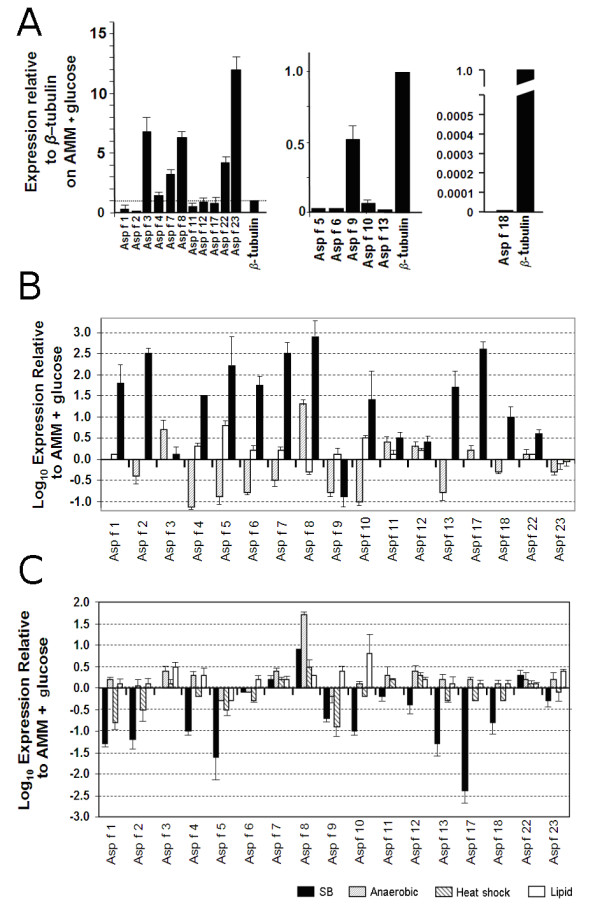
Figure 2.

Expression levels of allergen genes in the presence of different culture conditions. A, expression levels of all allergens relative to a β-tubulin comparator during growth on AMM + 1% glucose showing detail of the low expression levels of Asp f 5, -6, -9, -10, -13 and -18 (same data as left panel). B, Expression levels of allergen genes in the presence of various oxidative stress inducing agents. Levels are shown on a log scale as expression relative to that observed without addition of oxidative stress inducing agents (AMM + 1% glucose, as shown in panel A). C, Expression levels of allergen genes under different growth conditions. Levels are shown on a log scale as expression relative to that observed without addition of oxidative stress inducing agents (AMM + 1% glucose, as shown in panel A). Error bars represent standard error of mean of biological replicates calculated using GraphPad PRISM 4.0.
