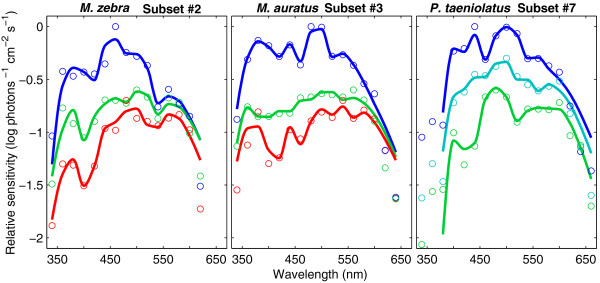
Figure 5.
Spectral sensitivity of cichlids reconstructed using the multiple-cone mechanism model. Measured (circles) and modeled (lines) relative spectral sensitivity for subsets 2 (M. zebra, left), 3 (M. auratus, middle) and 7 (P. taeniolatus, right). The low sensitivity at 340-380 nm in subset 7 corresponds to β-band absorption of the RH2b, RH2a and LWS pigments and was not modeled. Relative spectral sensitivity of each species was measured under three background conditions: long-wavelength isolation (LW, red), control (green) and short-wavelength isolation (SW, blue). In P. taeniolatus, LW was replaced by Dim short-wavelength isolation (Dim-SW, cyan).

