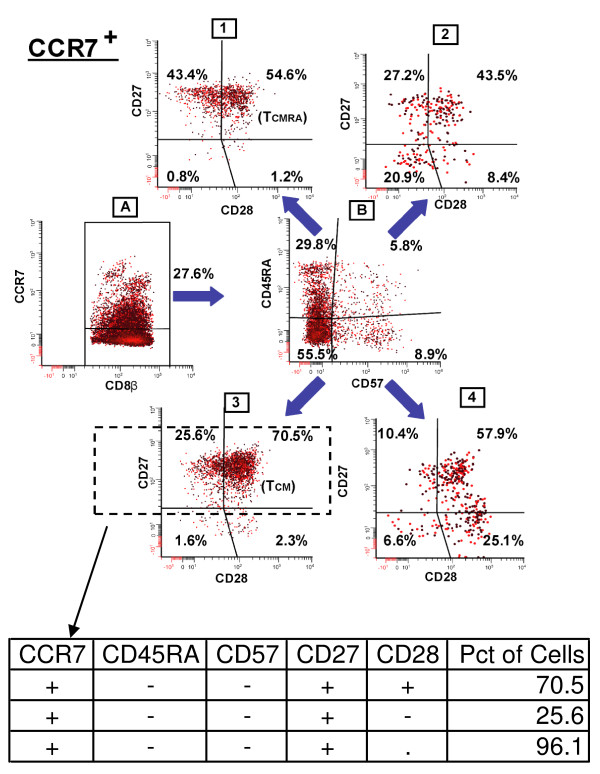
Figure 1.
Representative gating strategy and additional phenotype set calculations. This figure illustrates a gating strategy in which CCR7+ cells are further categorized by positive or negative expression of CD45RA and CD57. Cells in each resulting quadrant (dot plot B) are then categorized based on CD27 and CD28 staining frequencies (dot plots 1-4). The callout table illustrates how the two phenotypes CCR7+CD45RA-CD57-CD27+CD28+ (+--++) and CCR7+CD45RA-CD57-CD27+CD28- (+--+-), marked by dotted lines, are aggregated to form a superset population, CCR7+CD45RA-CD57-CD27+ (+--+.), in which CD28 expression is unspecified.

