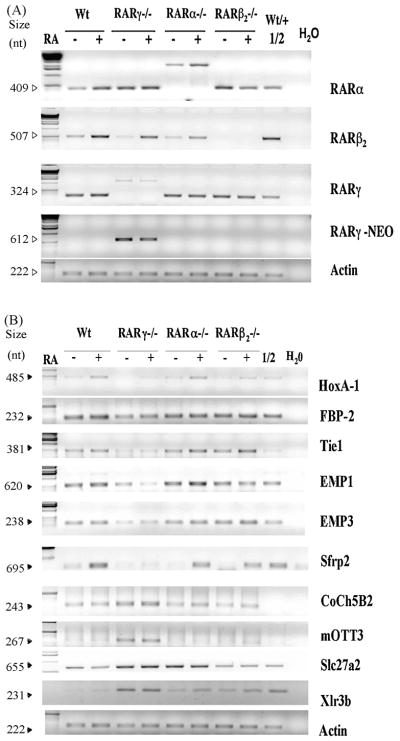
Figure 2. Semi-quantitative RT-PCR analyses of selected genes, FBP-2, Tie1, EMP1, EMP3, Sfrp2, Coch5B2, mOTT3, mFATP2, and Xlr3b, in F9 Wt, RARγ−/−, RARα−/− and RARβ2−/− cell lines in response to RA.
A and B, total RNA was extracted from the F9 Wt, RAR γ−/−, RARα−/−, RARβ2−/− cells cultured in the presence or absence of 1 μM RA for 24 h. An equivalent amount of RNA (5 μg) was subjected to RT-PCR with oligonucleotide primers specific for the indicated genes. The PCR-reactions were stopped between the 22ndand 32nd cycles depending on the gene being tested to ensure linear amplification ranges. PCR-amplified products were electrophoresed in 1% agarose gels and the products were stained with ethidium bromide. The 1:2 dilution of cDNA from RA-treated F9 Wt or RA-treated F9 RARγ−/− samples was used to indicate the linear amplification ranges for genes which showed increased mRNA levels in RARγ−/− cells or decreased levels in RARγ−/− cells, respectively. The sizes of the amplified bands are indicated on the left. These assays were repeated using three different RNA preparations, and similar results were obtained.

