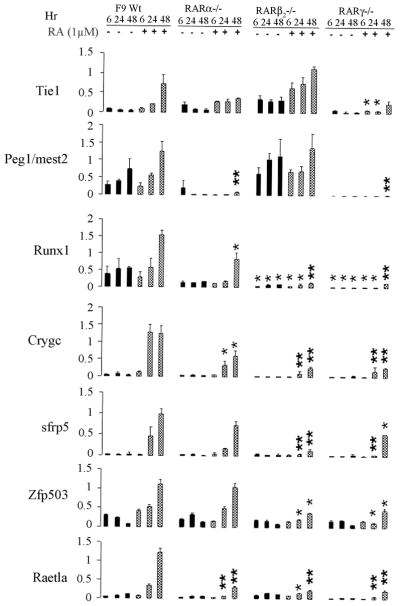
Figure 5. Real-time RT-PCR analyses of Tie1, Peg1/mest2, Runx-1, crygc, sfrp5, Zfp503, and Raet1a, in F9 Wt, RARγ−/−, RARα−/−, and RARβ2−/− cell lines in response to RA.
Total RNA was extracted from the F9 Wt, RAR γ−/−, RARα−/−, RARβ2−/− cells cultured in the presence or absence of 1 μM RA for 6, 24, or 48 h. An equivalent amount of RNA (5 μg) was subjected to RT-PCR with primers specific for the indicated genes. Real-time quantitative (SYBR green) PCR of the indicated genes was performed and the mRNA levels were normalized to β-actin mRNA levels. The data are shown as fold increases in mRNA levels relative to the β-actin mRNA levels at each condition. Y axis, relative mRNA expression level. The results shown here are derived from three independent experiments with triplicates. The normalized mRNA levels of F9 RARα−/−, RARβ2−/−, RARγ−/− cell samples were compared to F9 Wt cell samples at the respective time points and drug treatments for statistical significance. The unpaired student’s t-test was used to determine the p values. bars, S.E. *, significant (P<0.05), **, very significant (P<0.001) in comparisons of the RNA values in the mutants with those in F9 Wt treated under the same condition.

