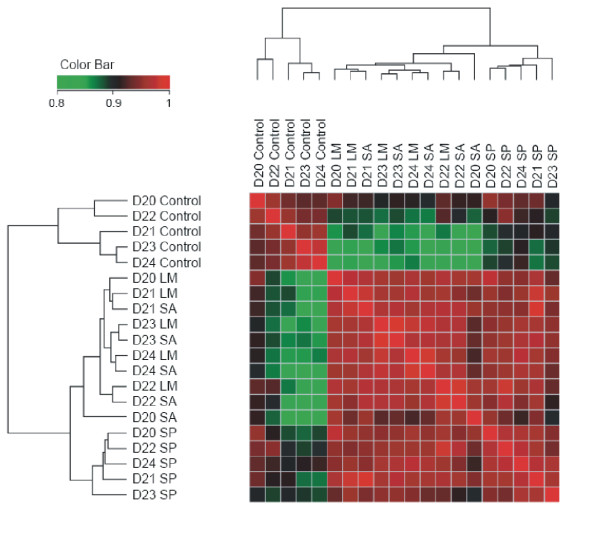
Figure 1.
Clustering of the correlation matrix of means for all microarray chips. All arrays were compared to each other and the correlation between the expression values was determined. The matrix of correlation coefficients was clustered using hierarchical clustering with the euclidean distance metric. L. monocytogenes and S. aureus are clustered together, while controls and S. pneumoniae form separate clusters. D: Donor; Infection with: LM: L. monocytogenes, SA: S. aureus, SP: S. pneumoniae.

