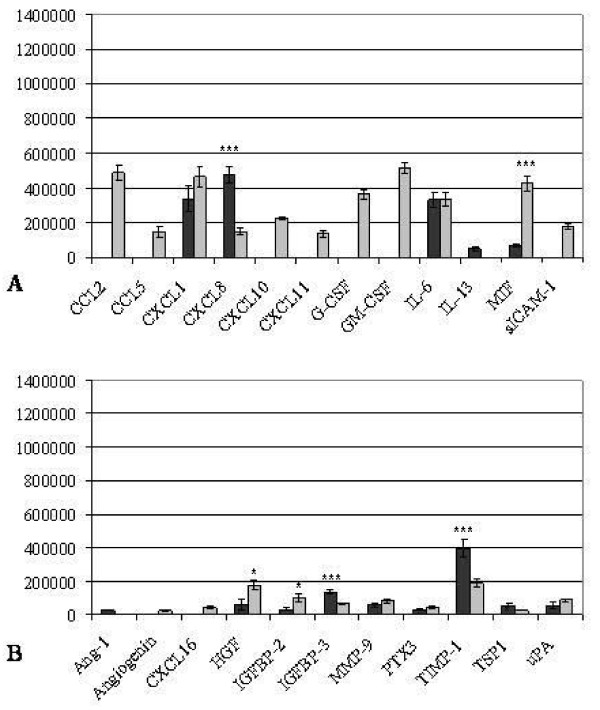
Figure 6.
Pixel density analysis of cytokine (A) and angiogenic factor (B) dot blot array of decidualized dSt-T1 (dark grey bars) and dKdS1 (light grey bars) followed by an IL-1ß incubation for 48h (n=4 each) (*p<0.05, **p<0.02, ***p<0.01). A) pixel analysis of secreted chemokines and B) pixel analysis of secreted angiogenic factors.

