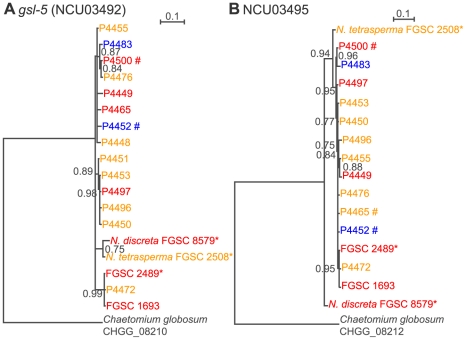
Figure 5. Gene phylogenies of gsl-5 (NCU03492) or PP2C (NCU03495) show no evidence of linkage disequilibrium with het-c (NCU03493) or pin-c (NCU03494).
Trees were derived from mRNA sequences assembled from RNA-Seq data from isolates shown by Bayesian analysis [91]. Bayesian posterior probabilities are presented at internal branches. Colors represent specificity based on het-c/pin-c haplotype (red: het-c1/pin-c1, yellow: het-c2/pin-c2, blue: het-c3/pin-c3). Alleles without species names are N. crassa. Alleles from sequenced strains are marked with ‘*’. Alleles not found in Figure 4 are marked with ‘#’. Note that allelic differences at NCU03492 and NCU03495 do not group with allelic specificity at NCU03493 (het-c) or NCU03494 (pin-c), indicating that balancing selection and linkage disequilibrium do not extend beyond het-c and pin-c.

