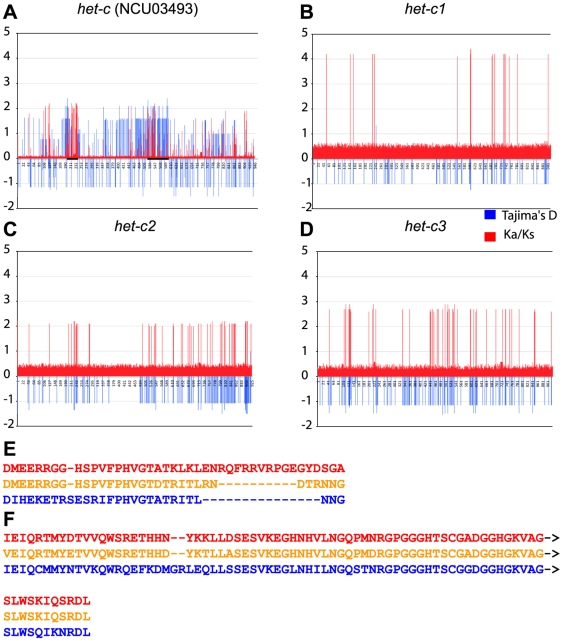
Figure 6. Measure of Ka/Ks ratios and Tajima's D on the coding region of het-c show evidence for balancing selection between, but not within allele classes.
A) Ka/Ks ratios (ω, ratio of nonsynonymous (Ka) to synonymous (Ks) nucleotide substitution rates; red) calculated for each codon for all het-c (NCU03493) alleles shows significant positive selection at positions 126, 215, 219, 232–235, 451 and 546 (P = 0.001) by likelihood ratio test (red).Tajima's D (blue) calculated for each codon shows borderline significant balancing selection (P<0.1) at positions 194–236 (which includes the het-c (NCU03493) allelic specificity region [27], [38]). Significant balancing selection (P<0.05) is also seen at positions 521–599. Both regions are shown as bold bars on (A). Evaluation of Ka/Ks (red) and Tajima's D (blue) within a het-c (NCU03493) allele class shows evidence for positive selection, but not balancing selection: B) het-c1 alleles, C) het-c2 alleles and D) het-c3 alleles. Note evidence for positive selection at different sites for all three het-c (NCU03493) alleles. E and F) Amino acid alignments of known (E) and new putative (F) specificity regions of het-c based on Tajima's D analysis. Bold bars on the x-axis of panel A indicate the locations of these regions.

