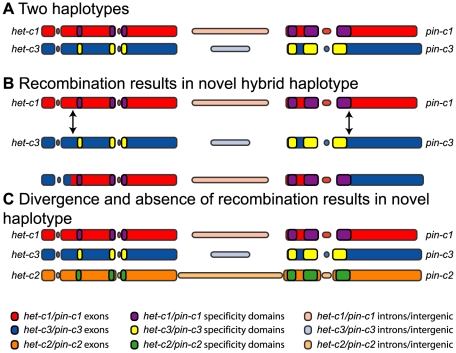
Figure 8. Model of the recombination-based emergence of het-c2/pin-c2 haplotype.
Colored bars indicate the coding and non-coding regions of each haplotype. Red indicates het-c1/pin-c1, blue indicates het-c3/pin-c3, and yellow indicates het-c2/pin-c2 haplotypes. Intergenic regions and introns are indicated by thinner bars and muted shades. Indels are show as spaces. The known and putative specificity regions of each haplotype are shown by purple, yellow, and green bars for het-c1/pin-c1, het-c3/pin-c3, and het-c2/pin-c2, respectively. All bars are drawn to scale.

