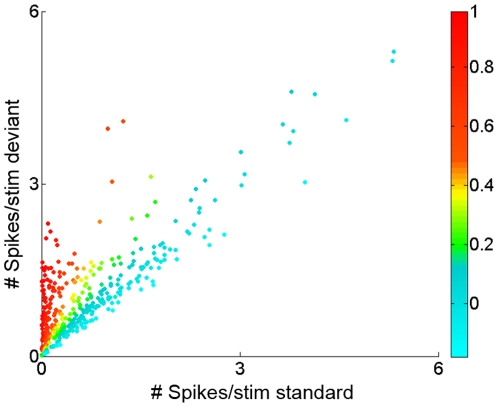
Figure 2. Responses of MGB neurons to the deviant and standard tones across the CSI range.
Scatterplot of the response of all neurons to the deviant tone vs response to the standard tone, with points color-coded according to the CSI value (different colors, right color bar). Low CSI values (around 0) correspond to neurons having a similar response to the standard and deviant stimuli, i.e., non-adapting neurons. Higher CSI values reflect a stronger response to the deviant than to the standard stimulus, i.e., adaptation to the standard. CSI values close to +1 (red color) indicate near-complete cessation of the responses to the standard tone. The most strongly responding neurons tended to be non-adapting.

