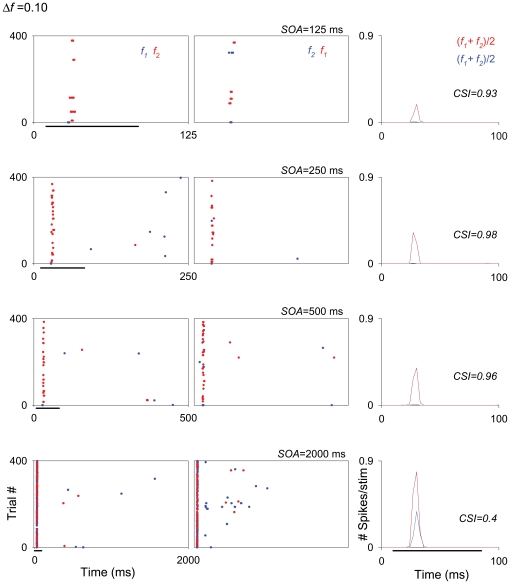
Figure 4. Firing rate decreases as repetition rate increases in the MGB neurons.
Example of an MGM neuron showing strong SSA across different SOAs (125, 250, 500 and 2000 ms; from the first to the fourth rows, respectively) at the same Δf (0.10). The firing rate of this neuron decreased with decrease in SOA, it exhibited strong SSA even under extreme conditions, i.e., at the combination of a Δf = 0.10 and SOA = 2000 ms (fourth row). In this figure and subsequent ones (e.g., Figs. 6, 8, 9, 11 and 13), the plots show responses as dot rasters, which plot individual spikes (red dots indicate responses to the deviant; blue dots indicate responses to the standard). Stimulus presentations are stacked along the y-axis (trial #; 400 trials each block). The time (ms) between trials (SOA) corresponds to the x-axis and is also indicated at the top right of each pair of raster plots. Because we tested different SOAs, the plots in the different rows have different x-axis scales corresponding to the SOA tested. Left and middle columns in each row represent the two blocks tested for each frequency pair (f1/f2 as standard/deviant; and f2/f1 as standard/deviant, respectively). PSTHs in the right column show the number of spikes/stimulus averaged over the two blocks [(f1+f2)/2; blue line is standard, red line is deviant]. Black horizontal lines under the plots indicate the duration of the stimulus (75 ms). The CSI calculated for each SOA condition (each row) is noted as an inset on the PSTHs.

