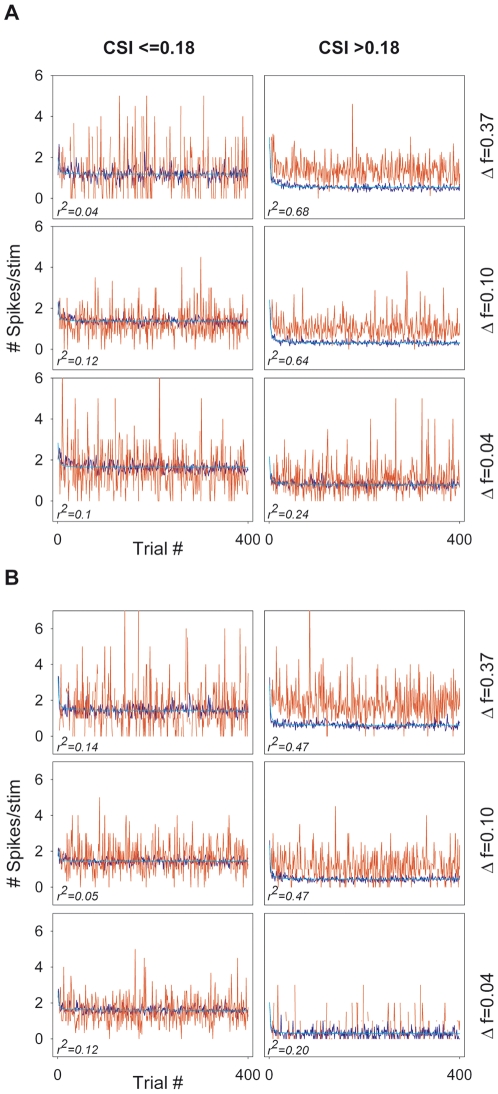
Figure 10. Time course of adaptation in the population of MGB neurons.
Average population firing rate (spikes/stimulus) versus trial number for SOA = 250 ms (A) and SOA = 500 ms (B) and the different Δfs tested, indicated to the right of each row. In both A and B, the left columns correspond to non-adapting neurons (CSI≤0.18) and right columns to adapting neurons (CSI>0.18). The response of the adapting neurons to the standard stimulus strongly declined after the first trials. A high proportion of their adaptation to the stimulus was explained by a polynomial inverse regression model [f = y0+(a/x)], for the majority of conditions; the amount of variance explained was reduced for the smallest Δf (0.04) (r2 = 0.24, 0.20 in A and B, respectively; p <0.001 for both conditions) and was very low for the non-adapting neurons, under all conditions.

