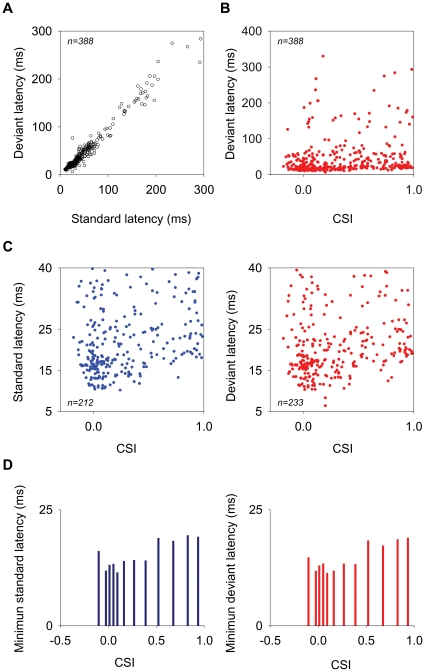
Figure 12. Response latencies in the MGB population of neurons.
(A) Mean first-spike latencies to the deviant versus standard stimulus for the MGB population. Latencies to the deviant were on average significantly shorter than those to the standard stimulus (Mean = 42.9 and 45.7 ms, respectively; paired t-test: t = 5.79, n = 388, d.f = 387, p<0.001). (B) Mean first-spike latencies to the deviant versus CSI. The shortest latencies o f highly adapting neurons were longer than those of non-adapting neurons. (C) Short-latency responses (<40 ms) to standard (left plot) and deviant (right plot) versus CSI. (D) The 10th percentile of the minimum latency distribution for the standard (left plot) and deviant (right plot) at different ranges of CSI. The minimal latencies of neurons with high CSI values (>0.5) were longer than those with lower CSI values, except for the most negative CSI values.

