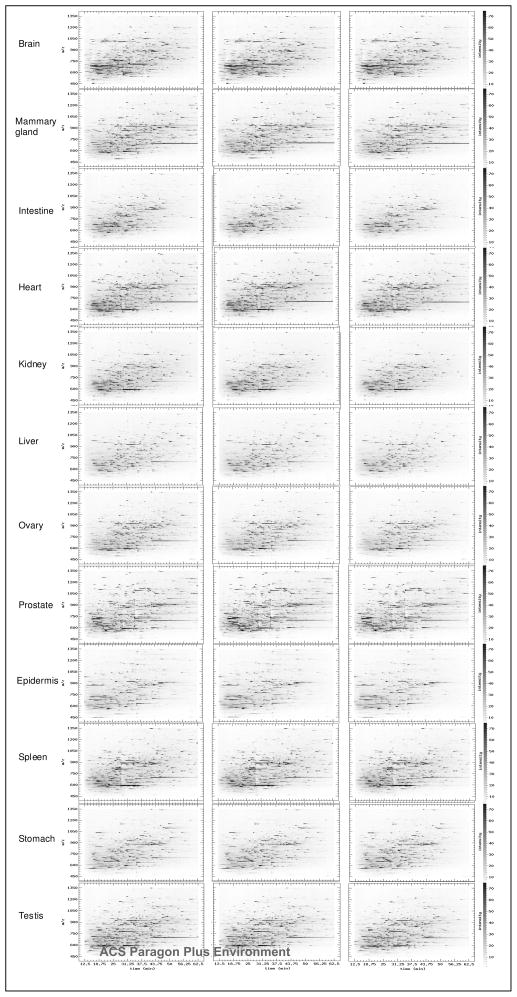
Figure 3.
LC-MS patterns of formerly N-linked glycopeptides from different tissues. Peptide3D display of peptides detected by LC-MS is shown by analyzing formerly N-linked glycopeptides with three reproducible analyses of the same sample. The detected peptides are indicated as black spots with respected retention time (in minute, X-axis), m/z (in Da, Y-axis), and intensity (darkness of the spots). The peptides from triplicate LC-MS analyses of the same sample are shown for peptides isolated from different tissues (labeled with tissue names).

