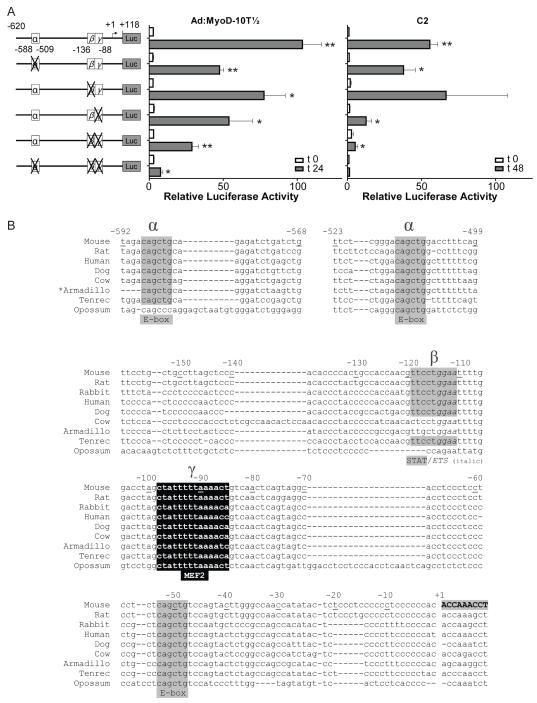
Figure 5. Characterizing promoter elements that control RGMc gene transcription during muscle differentiation.
A. Results are depicted of luciferase assays in differentiating Ad:MyoD-10T½ cells (left panel) and C2 myoblasts (right panel) transiently transfected with reporter genes containing substitution mutations of the mouse RGMc promoter (illustrated on the maps to the far left; details are in (B) and ‘Materials and Methods’). Cells were incubated in DM for 0 (white bars), or 24 or 48 hr (gray bars) before analysis. The graphs depict results of 3 - 10 independent experiments (mean ± S.E.), each performed in duplicate (* - p < 0.05, ** - p < 0.001, vs. t 0). B. Comparative mapping of RGMc promoter elements from different species. DNA sequence alignment of part of the proximal RGMc promoter from 9 mammalian species. Highlighted regions include paired E-boxes at −588 to −583 and −514 to −509 (α-site), the β-site from −120 to −110, and the γ site, a putative MEF2 element, from −98 to −85. Another E-box also is indicated at −53 to −48. Mouse exon 1 is in upper case and bold letters.

