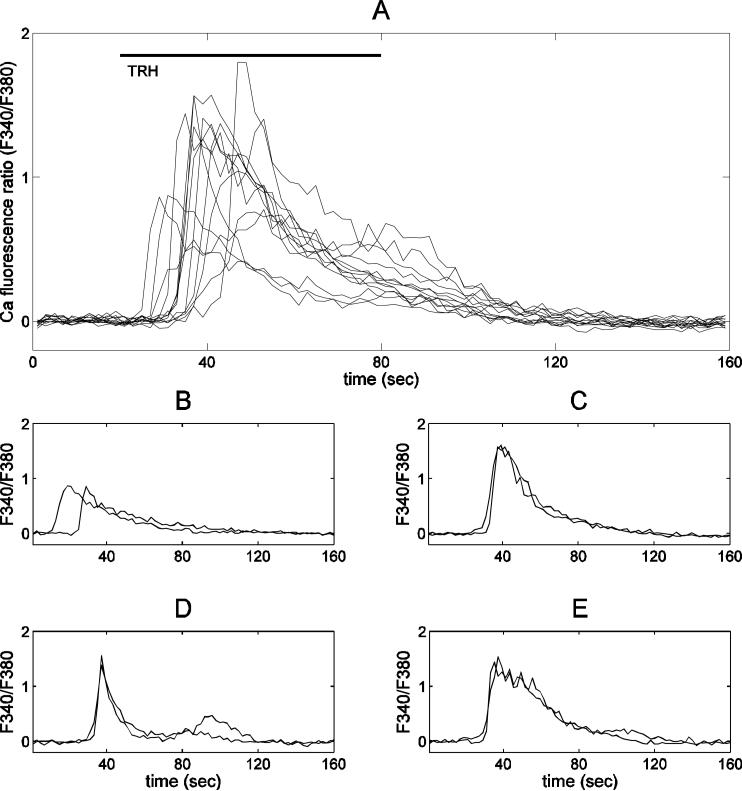
Figure 3.
Heterogeneity of the Ca2+ response to TRH in pituitary lactotrophs. In all panels the x-axis shows time in seconds, and the y-axis shows the Ca2+ fluorescence ratio (F340/F380). (A) Thirteen individual Ca2+ traces from the same experiment. Extensive variation exists in the peak, area, latency of response, and decay rate. (B-E) Examples of single cell Ca2+ traces from the same experiment showing very similar responses to two successive challenges of TRH 30 minutes apart.

