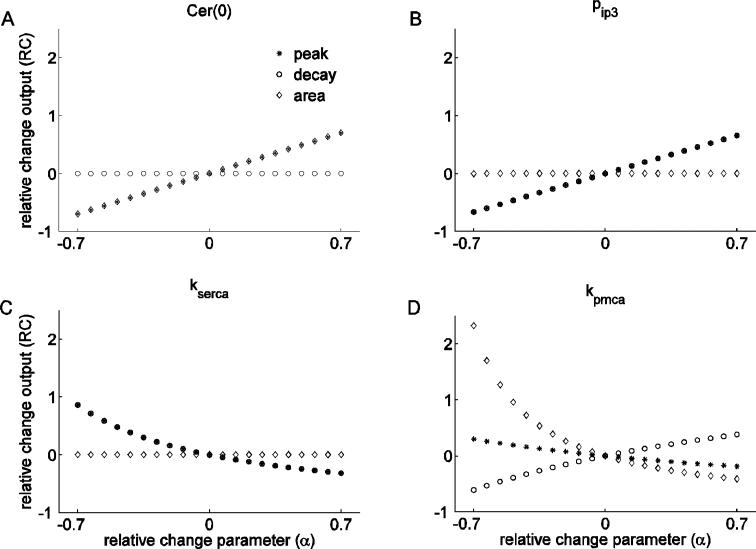
Figure 4.
Single parameter sensitivity analysis. In all panels the x-axis shows the relative change in the parameter value, and the y-axis shows the corresponding relative change in output. (A) Changes in Cer(0) have identical effect on the peak and the area of the response, but no effect on the decay rate. (B) Changes in pip3 affect peak and decay rate in the same way, but have no effect on the area. (C) Changing kserca affects peak and decay rate in the same way, but has no effect on the area. (D) Changes in kpmca have different effects on all features.

